

We actually do have more Ws than we chose to give ourselves credit for.
Time of reference makes a huge difference

This newsletter was due on Sunday, and as much as I tried to show up at all cost, my schedule and body had other plans for me. So I’m showing up few hours after Sunday, hoping that this well-thought episode makes up for any disappointment you may have felt. ❤️
Time of reference makes a huge difference.
If we decide to examine the U.S economy for a period of 10 years, say 1930-1940. The GDP per capita for that period, if represented on a graph, shows a general downward movement. Maybe a few highs here and there, but still slopes downward.
What could have contributed to the economic downfall during this period? Well, a lot of things. A war that claimed a lot of lives, a pandemic/disease outbreak that crippled the economy, a natural disaster that killed crops and livestock, a bad government that embezzlement money and made a lot of bad decisions, inflation etc etc.
Now, what if we decide to examine the GDP per capita of this same country but with a larger time frame instead, say 1850-2000, 160 years if my calculations are correct. What kind of graph will we find? Or to put simply, how well has the economy of a this country performed in those 160 years?
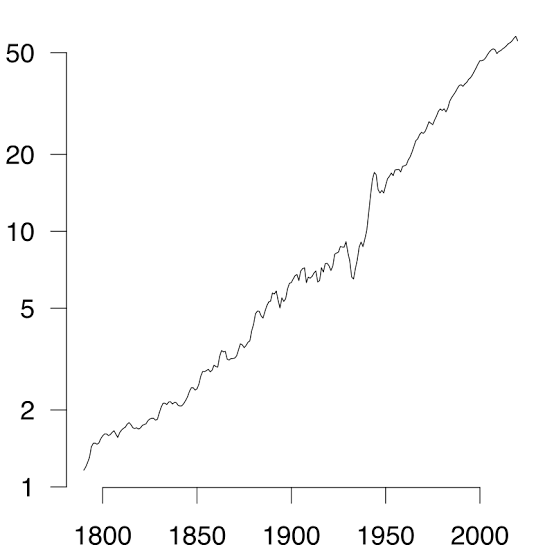
The standard of living increased 20-fold. That’s a huge one! Looking at the graph from a larger scale as seen above would probably be a better way to measure growth in this instance. By the way, it would be unfair to generalize how well the economy has performed by a few years of unfortunate (perhaps uncontrollable) circumstances.
I never really liked Economics as a subject in school nor did I find it at all intriguing, so why am I suddenly talking GDP per capita and economic growth? Well let’s just say the same principle can be applied to our personal lives.
Just like the GDP per capita illustration, we may decide to examine our lives with the shorter or longer time frame. You may agree with me that it would be unfair to judge our whole lives —or our general growth as an individual— by a couple of circumstances that may have made our graphs generally slope downward. This doesn’t mean there isn’t any growth, we just may not realize it.
But when we decide to step back to examine the graph with an expansive time frame, we discover that although we may have a lot of losses, we generally have more wins than losses. Either that, or we have one big W that supersedes all the Ls we had been getting.
But there’s a catch; this only happens if we keep up our pace, or to put simply, keep putting in the work.
Now, let me rephrase.
If we keep up our pace, at the end of the day when we take a holistic view at the graph of our lives —or our growth in it’s entirety— we may find out that the gradient turns out to be positive and graph generally slopes upward, and that we actually do have more Ws than we choose to give ourselves credit for.
I write about my learnings on personal growth, life, lessons, and experiences. Kindly subscribe and share if you find it relatable.
Have a fantastic week!
Yosola.
President don give me motivation
This is brilliant Yosola. Well done.